
Is your social media activity benefiting your business? Is it worth the effort and cost that it takes to post regularly to your followers? How do you measure their engagement and work out whether you are a Facebook eagle or an Instagram flop? Social media platforms calculate how many times your posts are viewed and interacted with, and this what is called the Engagement Rate.
The Engagement Rate is the number of comments, shares, clicks, likes and smiley faces expressed as a percentage of the total people a post reached. An engagement rate of above 1% is good, 0.5% to 0.99% is average, and anything below 0.5% needs improvement.
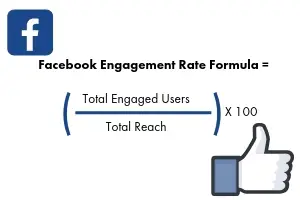
Facebook Engagement Rate
So how is this calculated? With Facebook the calculation is a little different than other social media platforms because Facebook likes to include the posts “reach”. This “reach” is the extent of this post appearing in individual feeds. This post might just be scrolled past and thus no “engagement” actually took place. The higher your reach but lack of engagement tells Facebook that your post is not interesting or worth sharing.
The calculation is:
Facebook Engagement Rate = Engaged Users x 100 / Total Reach
Where do you find these metrics in Facebook ?
- Go to your page in Facebook
- Click ‘Insights’ in the top menu
- Facebook Insights link
- Click ‘Export Data’ in the top right of the page
- Export Data Facebook
- Choose ‘Post Data’ from the pop up
- Facebook Insights Post Report
- Choose a date range of the posts you’re interested in (Note: This is to choose posts, not engagements – the number of engagements and total reach will cover the whole lifetime of the posts regardless of the date range chosen here).
- Click ‘Export Data’ in the bottom right of this pop up
- Export Data button
- In the spreadsheet that gets downloaded, look for the columns titled ‘Lifetime Post Total Reach’ and ‘Lifetime Engaged Users’, and use the data from there to work out your Facebook Engagement Rate
Instagram Engagement Rate
If you have an Instagram Business profile, you have access to engagement analytics. If you don’t you will have to manually spend a few minutes each day tracking who has liked, shared and commented on your posts. Best to get an Instagram Business profile. Tap your profile icon on the bottom right of your screen to see your profile home. Then tap the graph icon on the upper right. Here you will see three tabs: Activity, Content, and Audience.
- Activity shows you profile visits, website clicks, reach, and impressions
- Content will tell you how many posts, Stories, and promotions you had for the week.
- Audience will give you a breakdown of your followers, including gender, age range, and top locations.
The calculation is :
Divide your total number of likes and comments by your follower count, and then multiply by 100 to give you the percentage.
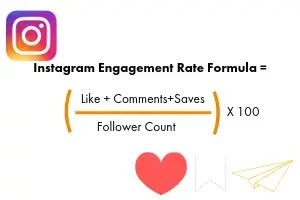
To really get in-depth analytics it is useful to see how many times your posts were saved to gauge true engagement, you can use this calculation:
Divide your total number of likes and comments and saved posts by your follower count, and then multiply by 100 to give you a percentage.
In your content Insights, Instagram actually includes saved posts in their engagement metric, so all you have to do is divide engagement by impressions and multiply by 100.
Summary
The benefit of doing this analysis will tell you which posts are gaining you followers who are interacting with you and your brand. Remember it is said to take seven interactions (Rule of Seven) for a person to recognize your brand and to make a purchase. Engagement is classically used to break through the first level of apathy – to get people to notice you. First impressions count and making your marketing dollars work for you the first time is incredibly valuable.
If you would like to discuss your social media activities or feel that your marketing dollars should be “reaching” a more engaged audience, schedule a quick discussion with our head parrot – Sonja Ceri